南極大陸を表示しよう ... 投影法の変換
筑波大学農林工学系 奈佐原(西田)顕郎
1. 南極大陸のDEMのダウンロード・インポート・モザイク処理
まず、GRASSを立ち上げ、latlon座標系でGRASSに入る。これまでの、
   LOCATION: latlon
   MAPSET: PERMANENT
でよい。
その上で、以下のコマンドを走らせる:
wget -c ftp://edcftp.cr.usgs.gov/data/gtopo30/global/*s60.tar.gz
for i in E060S60 E120S60 W000S60 W060S60 W120S60 W180S60; do
tar zxvf `echo $i | tr A-Z a-z`.tar.gz
r.in.gdal input=$i.DEM output=$i; r.null map=$i setnull=55537
rm $i.*
done
g.region n=-60 s=-90 w=-180 e=180 res=0.05
for i in E060S60 E120S60 W000S60 W060S60 W120S60 W180S60; do
r.mapcalc "dummy_${i}=if(isnull(${i}),-1,${i})"; done
r.mapcalc "dummy=max(dummy_E060S60,dummy_E120S60,dummy_W000S60,dummy_W060S60,dummy_W120S60,dummy_W180S60)"
r.mapcalc "Antarctic=if(dummy==-1,null(),dummy)"
r.null map=Antarctic setnull=55537
d.mon x0
d.rast Antarctic
元データがリンク切れの場合は、EarthExplorerからDLすること。(2016/10/13 水落・新井)
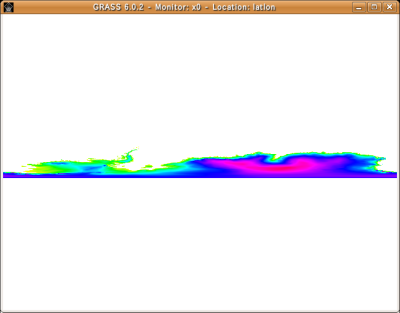
こんなかんじで南極大陸の絵が見えたらOK。そしたらexitコマンドで、いったんGRASSを抜ける。
2. 南極点を中心とする正射方位図法のlocationを用意する
GRASSを再び立ち上げる。しかしこんどは、これまでのlatlonではなく、南極点を中心とする正射方位図法(orthographic)のlocationを新たに作り、そこに入るのである:
$ grass
ここで右下のProjection valuesを押す。
  LOCATION: orthographicS
  MAPSET: PERMANENT
Would you like to create location <orthographic> ? (y/n) [y] y
To create a new LOCATION, you will need the following information:
1. The coordinate system for the database
       x,y (for imagery and other unreferenced data)
       Latitude-Longitude
       UTM
       Other Projection
2. The zone for the UTM database
  and all the necessary parameters for projections other than
  Latitude-Longitude, x,y, and UTM
3. The coordinates of the area to become the default region
  and the grid resolution of this region
4. A short, one-line description or title for the location

Do you have all this information? (y/n) [y] y

Please specify the coordinate system for location <orthographic>

A   x,y
B   Latitude-Longitude
C   UTM
D   Other Projection
RETURN to cancel
> d
Other Projection coordinate system? (y/n) [y] y
Please enter a one line description for location <orthographic>
> (何も入れないでENTER)
=====================================================

=====================================================
ok? (y/n) [n] y
Please specify projection name
Enter 'list' for the list of available projections
Hit RETURN to cancel request
> ortho
Do you wish to specify a geodetic datum for this location?(y/n) [y] y
Please specify datum name
Enter 'list' for the list of available datums
or 'custom' if you wish to enter custom parameters
Hit RETURN to cancel request
> wgs84
Now select Datum Transformation Parameters
Enter 'list' to see the list of available Parameter sets
Enter the corresponding number, or <RETURN> to cancel request
>1
   Enter Central Parallel [lat_0] (0) :-90

   Enter Central Meridian [lon_0] (20E) :0
Enter plural form of units [meters]: km
Enter singular for unit: 0
Enter conversion factor from km to meters: 1000
NORTH EDGE:4000
SOUTH EDGE:-4000
WEST EDGE:-4000
EAST EDGE:4000
GRID RESOLUTION
    East-West:     5
  North-South:     5

 projection:   99 (Other Projection)
 zone:         0
 north:       4000
 south:       -4000
 east:        4000
 west:        -4000

 e-w res:      5
 n-s res:      5

 total rows:             1600
 total cols:             1600
 total cells:       2,560,000


Do you accept this region? (y/n) [y] > y
3. 南極大陸のDEMを、latlon図法から正射方位図法へ変換
上で新たに作ったorthographicというlocationの上で、以下のGRASSコマンドを走らせる:
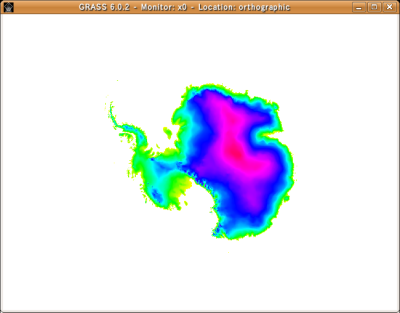
g.region n=4000 s=-4000 w=-4000 e=4000 res=5
r.proj input=Antarctic location=latlon mapset=PERMANENT output=Antarctic
d.mon x0
d.rast Antarctic
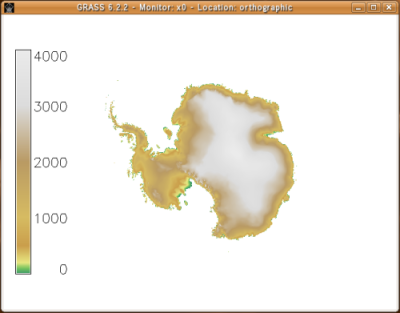
カラーテーブルを変えて、さらに、スケールバーも表示してみよう:
d.erase
r.colors map=Antarctic rules=srtm
d.rast Antarctic
d.legend map=Antarctic range=0,4000 -f
- (2016/10/13 水落・新井追記)
GRASSの最近のバージョンでは、r.projがうまく動かないことがある。その場合は、gdalコマンドを用いてGRASS外で変換する方法がある。まずlatlon上で作成したモザイク画像を、
> r.out.gdal input=Antarctic output=Antarctic_latlon.tif
で吐き出す。その後、
$ gdalwarp -t_srs '+lat_0=-90 +lon_0=0 x_0=0 +y_0=0 +no_defs +a=6378137 +rf=298.257223563 +towgs84=0.000,0.000,0.000 +unit=km +datum=wgs84 +proj=ortho' Antarctic_latlon.tif Antarctic_ortho.tif
とし、ortho上に読み込む。(警告が出ることがあるが、その場合は -oフラグをつける)
> r.in.gdal input=Antarctic_ortho.tif output=Antarctic -o
> d.rast Antarctic
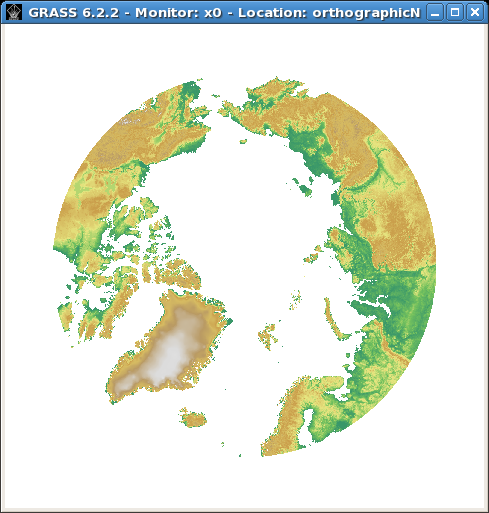
実習課題
orthographic図法で北極海周辺のDEMを表示せよ。
latlonで:
wget -c ftp://edcftp.cr.usgs.gov/data/gtopo30/global/*n90.tar.gz
for i in E020N90 E060N90 E100N90 E140N90 W020N90 W060N90 W100N90 W140N90 W180N90; do
tar zxvf `echo $i | tr A-Z a-z`.tar.gz
r.in.gdal input=$i.DEM output=$i; r.null map=$i setnull=55537
rm $i.*
done
g.region n=90 s=60 w=-180 e=180 res=0.05
for i in E020N90 E060N90 E100N90 E140N90 W020N90 W060N90 W100N90 W140N90 W180N90; do
r.mapcalc "dummy_${i}=if(isnull(${i}),-1,${i})"; done
r.mapcalc "dummy=max(dummy_E020N90,dummy_E060N90,dummy_E100N90,dummy_E140N90,dummy_W020N90,dummy_W060N90,dummy_W100N90,dummy_W140N90,dummy_W180N90)"
r.mapcalc "Arctic=if(dummy==-1,null(),dummy)"
r.null map=Arctic setnull=55537
d.mon x0
d.rast Arctic
orthographicN (北極用に作りなおすこと)で:
g.region n=4000 s=-4000 w=-4000 e=4000 res=5
r.proj input=Arctic location=latlon mapset=PERMANENT output=Arctic
d.mon x0
d.rast Arctic
→ GIS入門に戻る。
Keyword(s):
References:[到達不能極はどこだ? ... バッファー解析] [GIS入門] [RICOH THETA]